Stay ahead with the inics blog
We regularly publish insightful articles on key topics related to data management, business intelligence, and data analytics—keeping you informed and ahead of industry trends.

EU AI Act Art. 10: Data Quality That Withstands Audits
What data engineering must deliver before the high-risk rules take effect (Part 1/3). In many organizations, data quality was long treated as a hygiene topic: important, but rarely decisive. With the introduction of the High-Risk rules, data quality becomes verifiable. It must be measurable, controllable, and evidentially demonstrable in operations.
Market Correction as a Strategic Opportunity
Why Ownership and Stability Are Becoming the New Currencies in BI & Analytics.

The 2025 Cloud Cost Crisis: Why Data, BI and AI Teams Must Act Before 2026
Cloud cost management collapsed in 2025 and almost nobody was prepared. According to Flexera, 84% of organisations now say cloud cost optimization is their top cloud challenge.¹ BCG reports that studies indicate up to 30% of cloud spend is wasted.² TechRadar reports that 94% of IT leaders struggle to optimize cloud costs, with limited visibility and unexpected cost fluctuations remaining persistent challenges.³ These numbers defined our year and they match what we saw across dozens of BI, data engineering, and AI environments. Cloud has become unpredictable and unpredictability is now a financial risk.

When Success Isn’t a Fixed Number - Measuring Success in a Non-Deterministic Data World
In traditional BI systems, success once seemed easy to measure: A dashboard saves time, automates reports, and reduces error rates. But even there, evaluation was never truly straightforward. How do you measure a better decision? Or the value of insights that prevent errors from occurring in the first place? Even in classical BI, it was never just about numbers, it was about decision quality and impact.
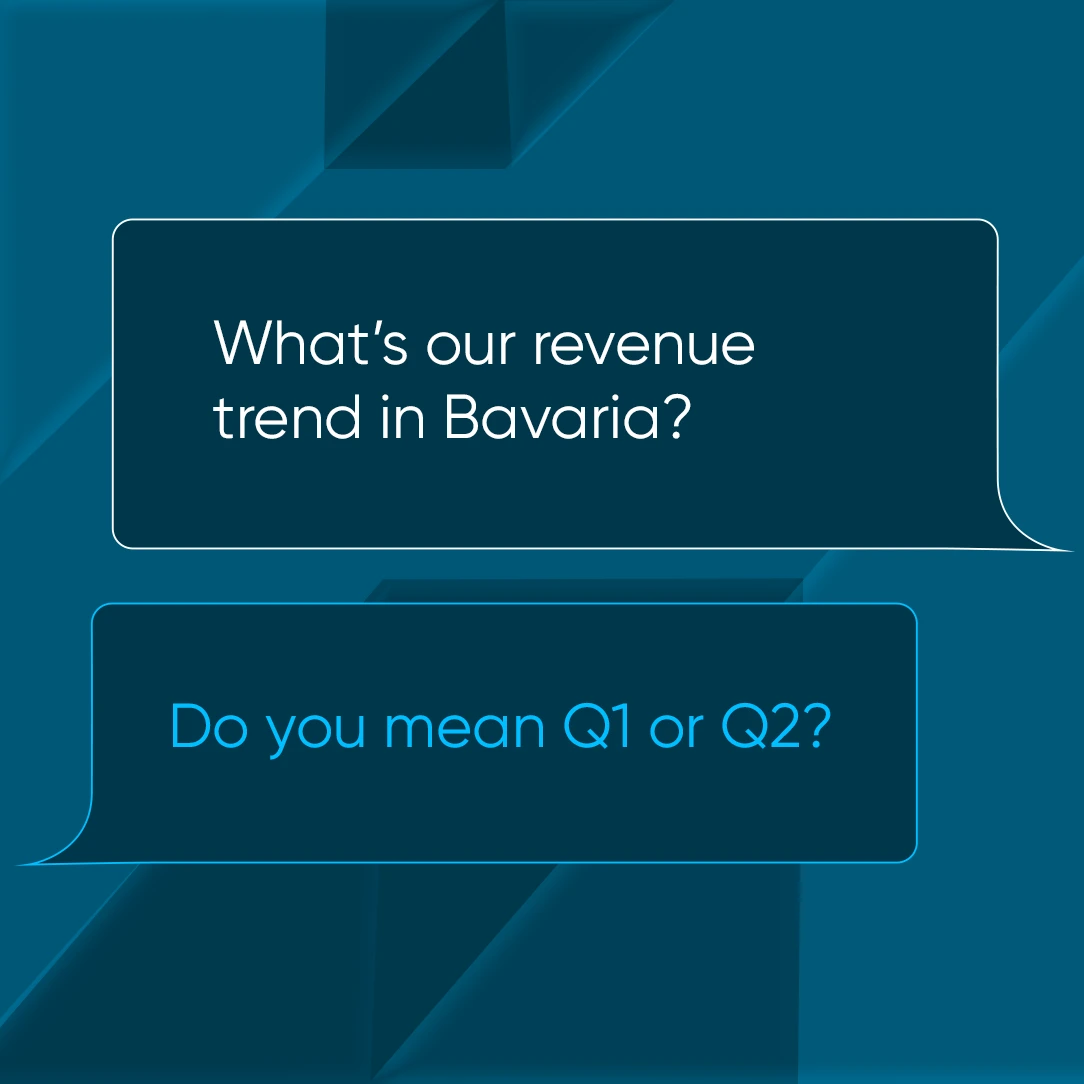
Databricks AI/BI Genie and the Future of Business Intelligence
We are witnessing a new wave in Business Intelligence (BI): the line between traditional dashboarding and natural data interaction is blurring.

Crime Scene: White Goods, Red Numbers
The Loading Dock - a Data Crime Story about Missing Controls, Alibis, and the Forensic Tracing of Numbers

Microsoft Fabric is Convenient – But Convenience Comes at a Price
Microsoft Fabric is currently being hailed as the new all-in-one solution in the BI universe. A platform that unites integration, transformation, and reporting in one interface, promising to finally eliminate data silos, system breaks, and complex architectures.

Pretty Charts: Why Hichert’s Principles Still Matter in Modern BI
BI has evolved dramatically. We now have AI-assisted forecasting, anomaly detection, and self-service tools at every manager’s fingertips. And yet, in most organizations, dashboards are more complex - not more useful. Executives don’t want visual fireworks. They want clarity. That’s why Hichert’s IBCS principles, developed long before “augmented analytics” became a buzzword, remain highly relevant today.

The Real Bottleneck in Business Intelligence Isn’t Data. It’s People.
Business Intelligence (BI) has never had more powerful tools. Platforms like Microsoft Fabric, Databricks, and Qlik deliver integrated pipelines, governance, and AI-driven insights at a scale that was unthinkable only a few years ago. And yet, many BI projects still fail. Not because the data is broken, but because the people side of BI is neglected. Here’s the leadership journey every BI initiative goes through, and the points where most stumble.